Full-channel marketing performance overview
Search campaign results for April 14-20
| Campaign | Status | Spend | Clicks | Impr. | CTR | CPC |
|---|---|---|---|---|---|---|
| Search | Staffing Keywords | Active | $260.42 | 39 | 1,932 | 2.02% | $6.68 |
| Search | Temp Agency Keywords | Active | $197.90 | 32 | 1,523 | 2.10% | $6.18 |
Combined Google Ads + Meta Ads dashboard snapshot
Facebook and Instagram ad results for April 14-20
| Campaign | Objective | Status | Spend | Leads | CPL |
|---|---|---|---|---|---|
| Lead Campaign | General Dynamic | Leads | Active | $167.58 | 5 | $33.52 |
| Traffic Campaign | General Dynamic | Traffic | Active | $68.00 | 0 | - |
| Lead Campaign | Same Time Zone | Leads | Active | $61.31 | 1 | $61.31 |
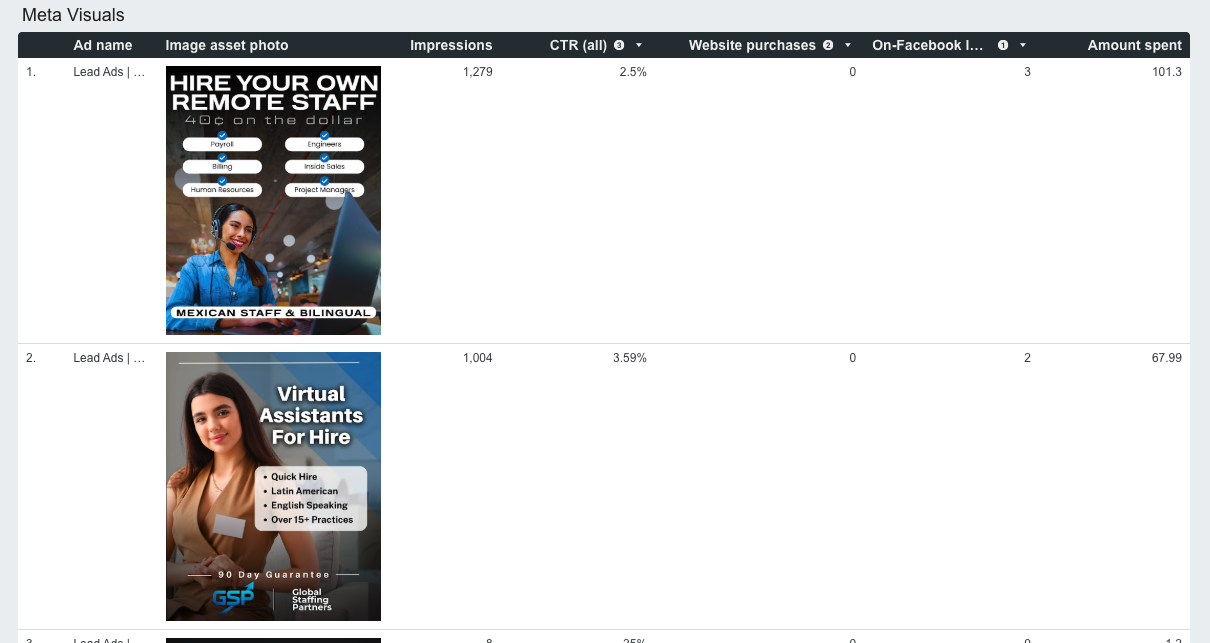
Top ad visuals driving engagement and conversions
Below are the ad creatives that performed best during April 14-20. These images are driving the highest engagement and lead conversions across our Meta campaigns.
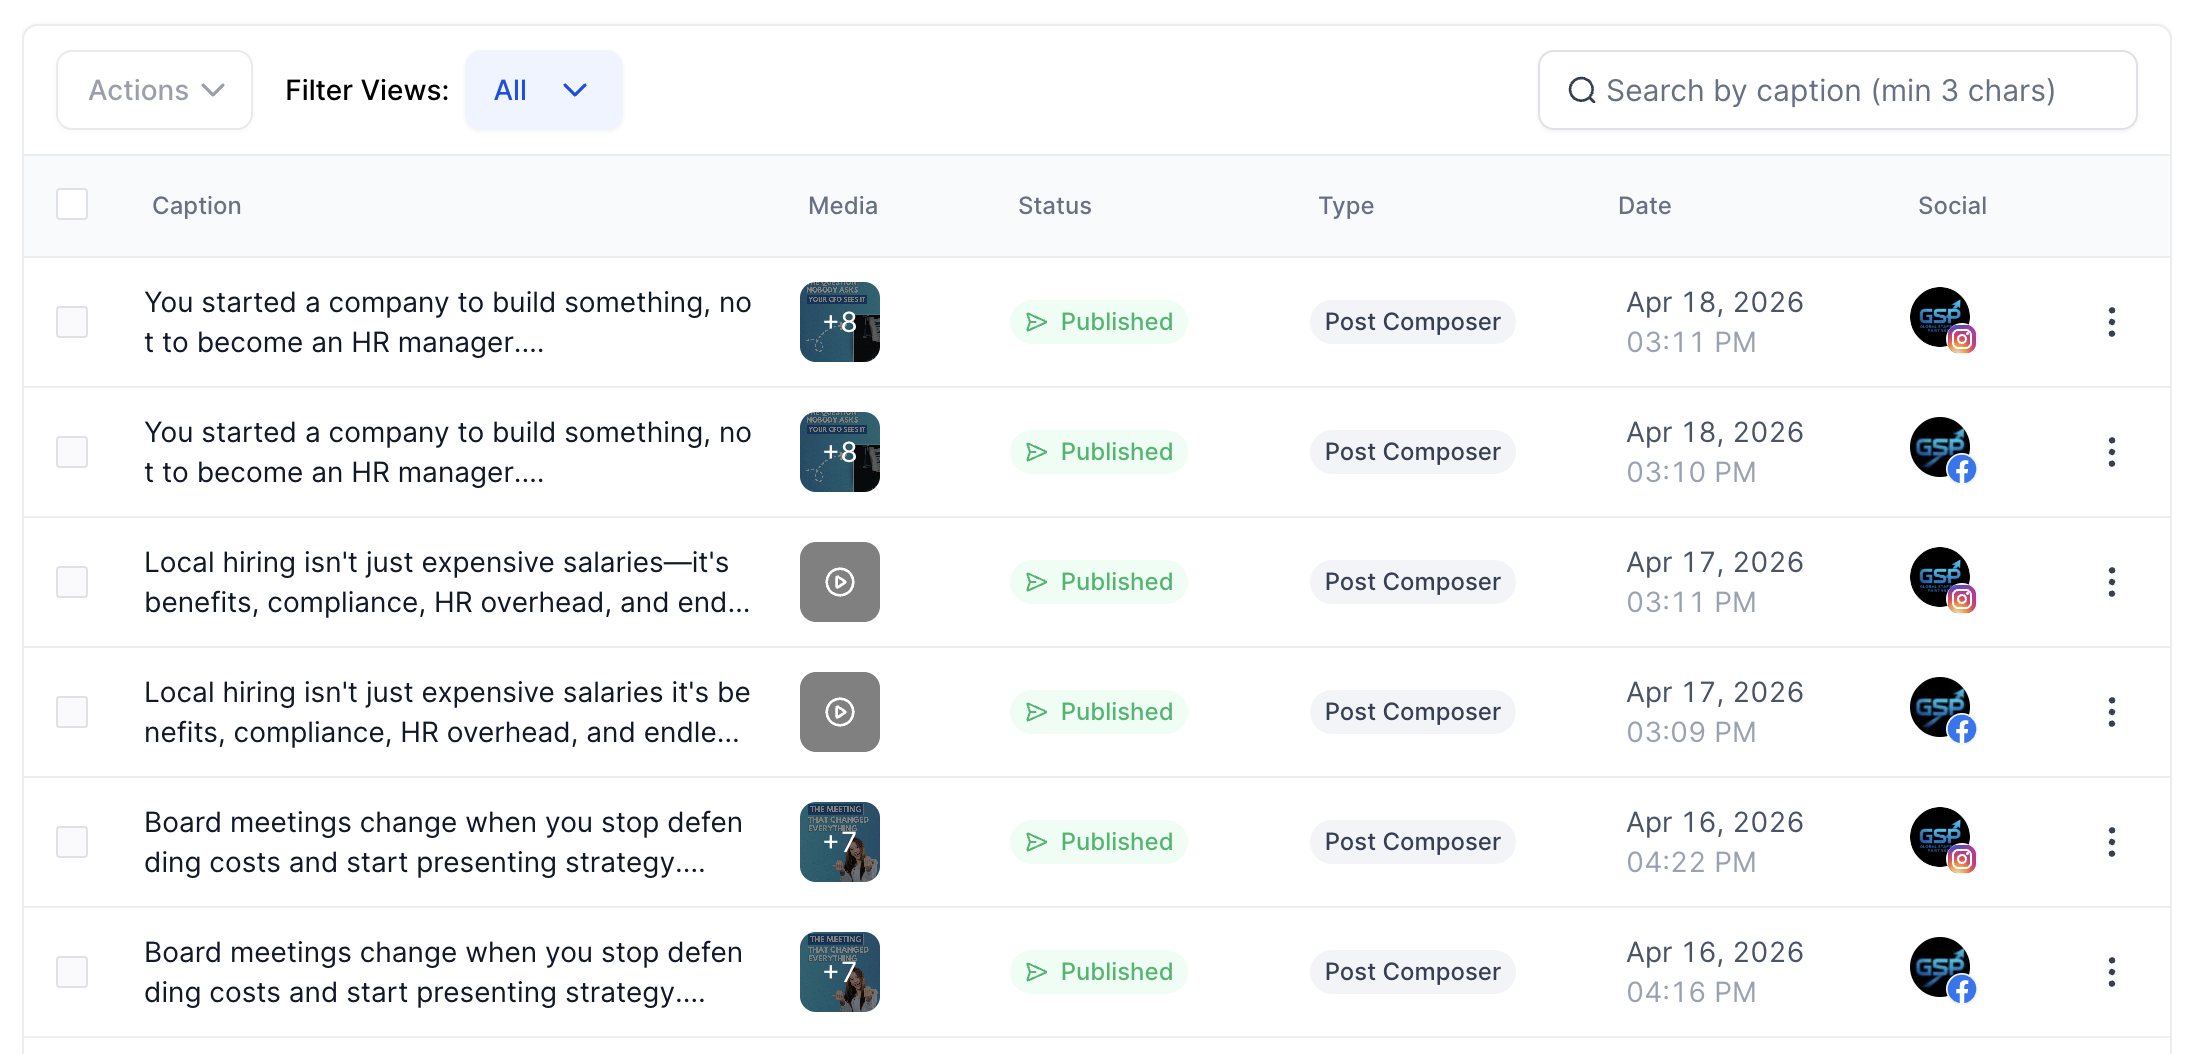
Organic social posts and engagement for the week
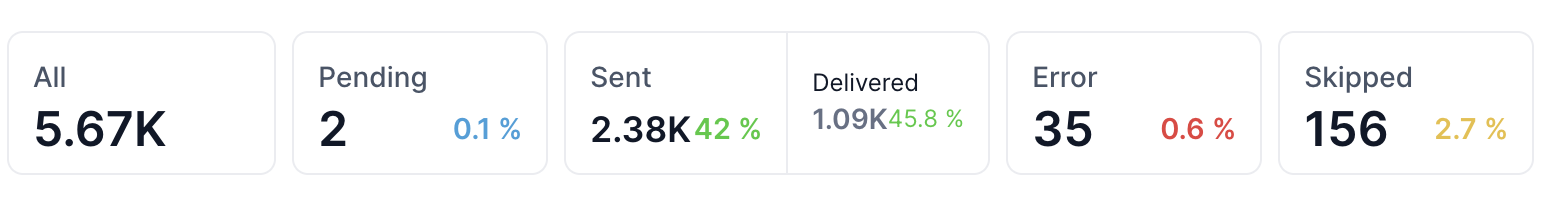
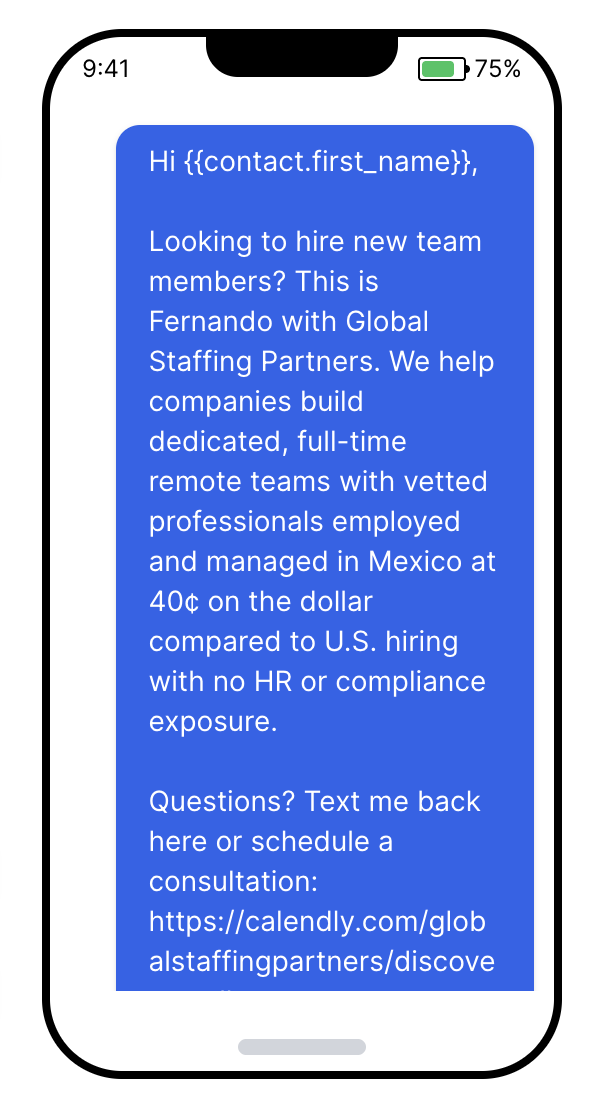
Bulk drip and mass drop text message outreach
Short-form video content created for social media
Email outreach and nurture campaigns
Work completed during April 14-20, 2026
melleka.com